Chapter 5 Maps
#----load all the libraries needed
library(tmap)

#http://www.stat.columbia.edu/~tzheng/files/Rcolor.pdf
5.1 Culture dot map
londonLSOAProfiles_inner <- londonLSOAProfiles[londonLSOAProfiles$InnerOuter == 'Inner London',]

culture_dots_london <- tm_shape(londonLSOAProfiles) + tm_fill(col = 'white') +
  tm_borders(col = 'dimgray', lwd = 0.3, lty = "solid") +
  tm_polygons() + tm_shape(culture[londonLSOAProfiles, ]) + tm_dots(col = "Cultural.Venue.Type") +
  tm_layout(frame=FALSE) +
  tm_legend(show =FALSE) +
  tm_credits("Greater London", position = c(0, 0.9), size=0.7)

culture_dots_inner_london <- tm_shape(londonLSOAProfiles_inner) +
  tm_borders(col = 'dimgray', lwd = 0.3, lty = "solid") +
  tm_polygons() + tm_shape(culture[londonLSOAProfiles_inner,]) + tm_dots(col = "Cultural.Venue.Type") +
  tm_layout(frame=FALSE) +
  tm_legend(show =FALSE) +
  tm_credits("Inner London", position = c(0.1, 0.9), size=0.7)

legend1 <- tm_shape(londonLSOAProfiles) +
    tm_polygons() + tm_shape(culture[londonLSOAProfiles,]) + tm_dots(col = "Cultural.Venue.Type") +
    tm_scale_bar(position=c(0.2, 0.6), text.size=0.6) +
    tm_compass(north=0, position=c(0.2, 0.8)) +
    tm_layout(legend.only = TRUE,
              legend.position=c(0.6, 0.6),
              asp=0,
              legend.stack = "horizontal",
              legend.width = 1
              #legend.outside = TRUE, legend.outside.position = "bottom"
              ) +
    tm_credits("Source: data.london - Cultural Infrasturcture Map", position=c(0.1, 0.3))

culture_dot_map = tmap_arrange(culture_dots_london, culture_dots_inner_london, legend1, ncol=2)

#culture_dot_map

#tmap_save(culture_dot_map, filename = "maps/density/cultural_infrastructure_dots_lsoa.png")
5.2 Culture frequency density map
culture_freq_london <- tm_shape(londonLSOAProfiles) +
  tm_borders(col = 'dimgray', lwd = 0.3, lty = "solid") +
  tm_polygons(col = 'culture_freq', style = 'log10') +
  tm_layout(frame=FALSE) +
  tm_legend(show =FALSE) +
  tm_credits("Greater London", position = c(0.1, 0.9), size=0.7 )

culture_freq_inner_london <- tm_shape(londonLSOAProfiles_inner) +
  tm_borders(col = 'dimgray', lwd = 0.3, lty = "solid") +
  tm_polygons(col = 'culture_freq',style = 'log10') +
  tm_layout(frame=FALSE) +
  tm_legend(show =FALSE) +
  tm_credits("Inner London", position = c(0, 0.9), size=0.7)

legend1 <- tm_shape(londonLSOAProfiles) +
    tm_polygons(title = "Culture Freq (km2)", col = "culture_freq") +
    tm_scale_bar(position=c(0.2, 0.6), text.size=0.6) +
    tm_compass(north=0, position=c(0.2, 0.8)) +
    tm_layout(legend.only = TRUE, legend.position=c(0.6, 0.6), asp=0.1) +
    tm_credits("Source: data.london - Cultural Infrasturcture Map", position=c(0.1, 0.3))

legend2 <- tm_shape(londonLSOAProfiles_inner) +
    tm_polygons(title = "Culture Freq (km2)", col ="culture_freq") +
    tm_scale_bar(position=c(0.2, 0.6), text.size=0.6) +
    tm_compass(north=0, position=c(0.2, 0.8)) +
    tm_layout(title = "Cultural Freq", legend.only = TRUE, legend.position=c(0.6, 0.6), asp=0.1)
    #+ tm_credits("Source: data.london - Cultural Infrasturcture Map", position=c(0, 0.3))

culture_freq_map = tmap_arrange(culture_freq_london, culture_freq_inner_london, legend1, legend2, ncol=2)

#tmap_save(culture_freq_map, filename = "maps/density/cultural_infrastructure_density_lsoa.png")

culture_freq_map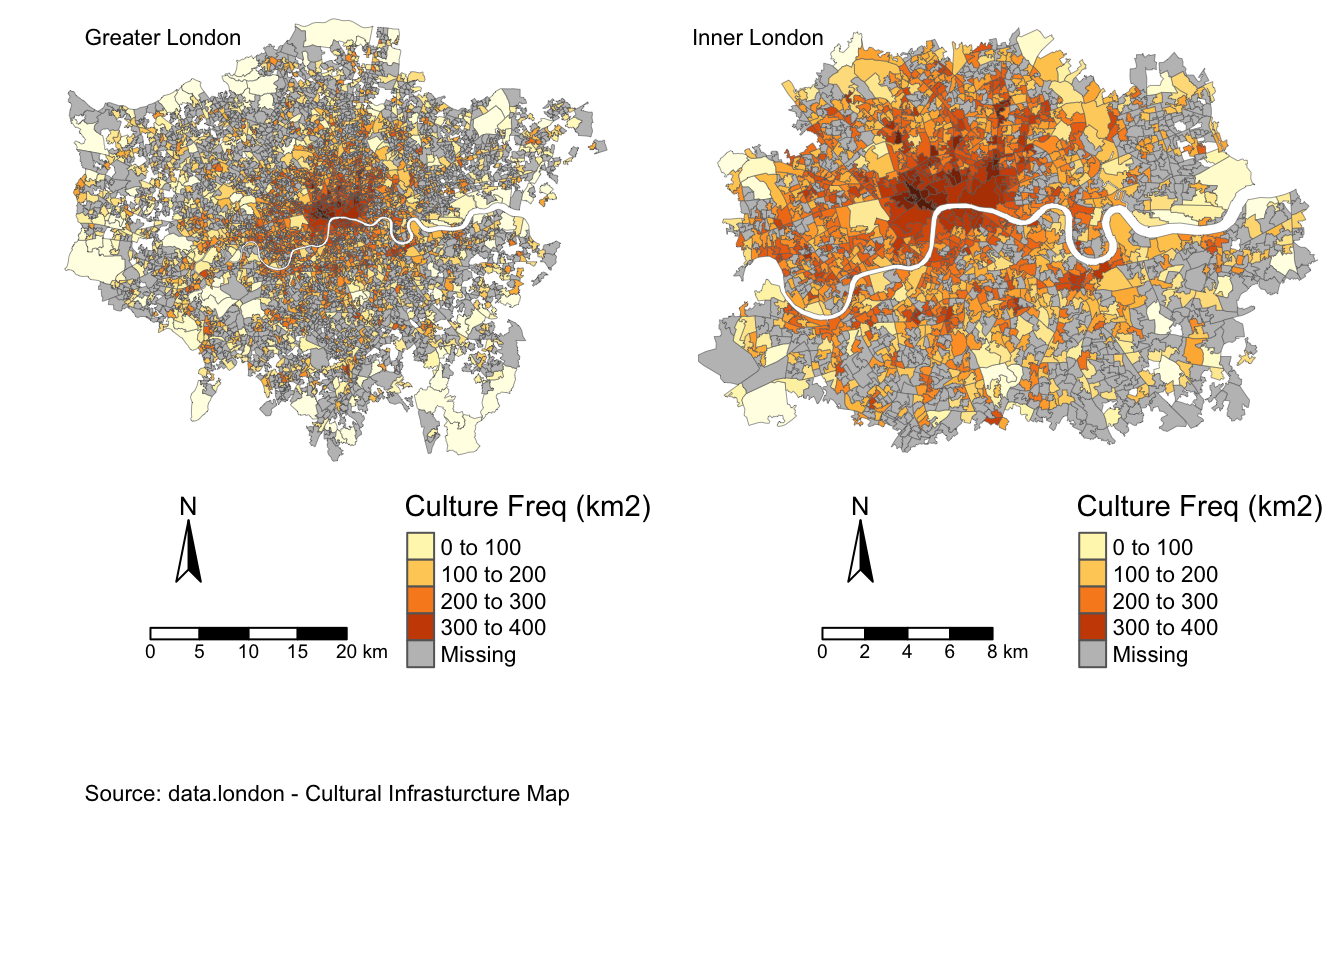
5.3 Culture rating density map
culture_rating_london <- tm_shape(londonLSOAProfiles) +
  tm_borders(col = 'dimgray', lwd = 0.3, lty = "solid") +
  tm_polygons(col = 'culture_rating', style = 'quantile') +
  tm_layout(frame=FALSE) +
  tm_legend(show =FALSE) +
  tm_credits("Greater London", position = c(0.1, 0.9), size=0.7 )

culture_rating_inner_london <- tm_shape(londonLSOAProfiles_inner) +
  tm_borders(col = 'dimgray', lwd = 0.3, lty = "solid") +
  tm_polygons(col = 'culture_rating', style = 'quantile') +
  tm_layout(frame=FALSE) +
  tm_legend(show =FALSE) +
  tm_credits("Inner London", position = c(0, 0.9), size=0.7)

legend1 <- tm_shape(londonLSOAProfiles) +
    tm_polygons(title = "Culture Rating", col = "culture_rating") +
    tm_scale_bar(position=c(0.2, 0.6), text.size=0.6) +
    tm_compass(north=0, position=c(0.2, 0.8)) +
    tm_layout(legend.only = TRUE, legend.position=c(0.6, 0.4), asp=0.1) +
    tm_credits("Source: data.london - Cultural Infrasturcture Map", position=c(0.1, 0.3))

legend2 <- tm_shape(londonLSOAProfiles_inner) +
    tm_polygons(title = "Culture Rating", col ="culture_rating") +
    tm_scale_bar(position=c(0.2, 0.6), text.size=0.6) +
    tm_compass(north=0, position=c(0.2, 0.8)) +
    tm_layout(legend.only = TRUE, legend.position=c(0.6, 0.4), asp=0.1)
    #+ tm_credits("Source: data.london - Cultural Infrasturcture Map", position=c(0, 0.3))

culture_rating_map = tmap_arrange(culture_rating_london, culture_rating_inner_london, legend1, legend2, ncol=2)

#tmap_save(culture_rating_map, filename = "maps/density/cultural_infrastructure_rating_lsoa.png")

culture_rating_map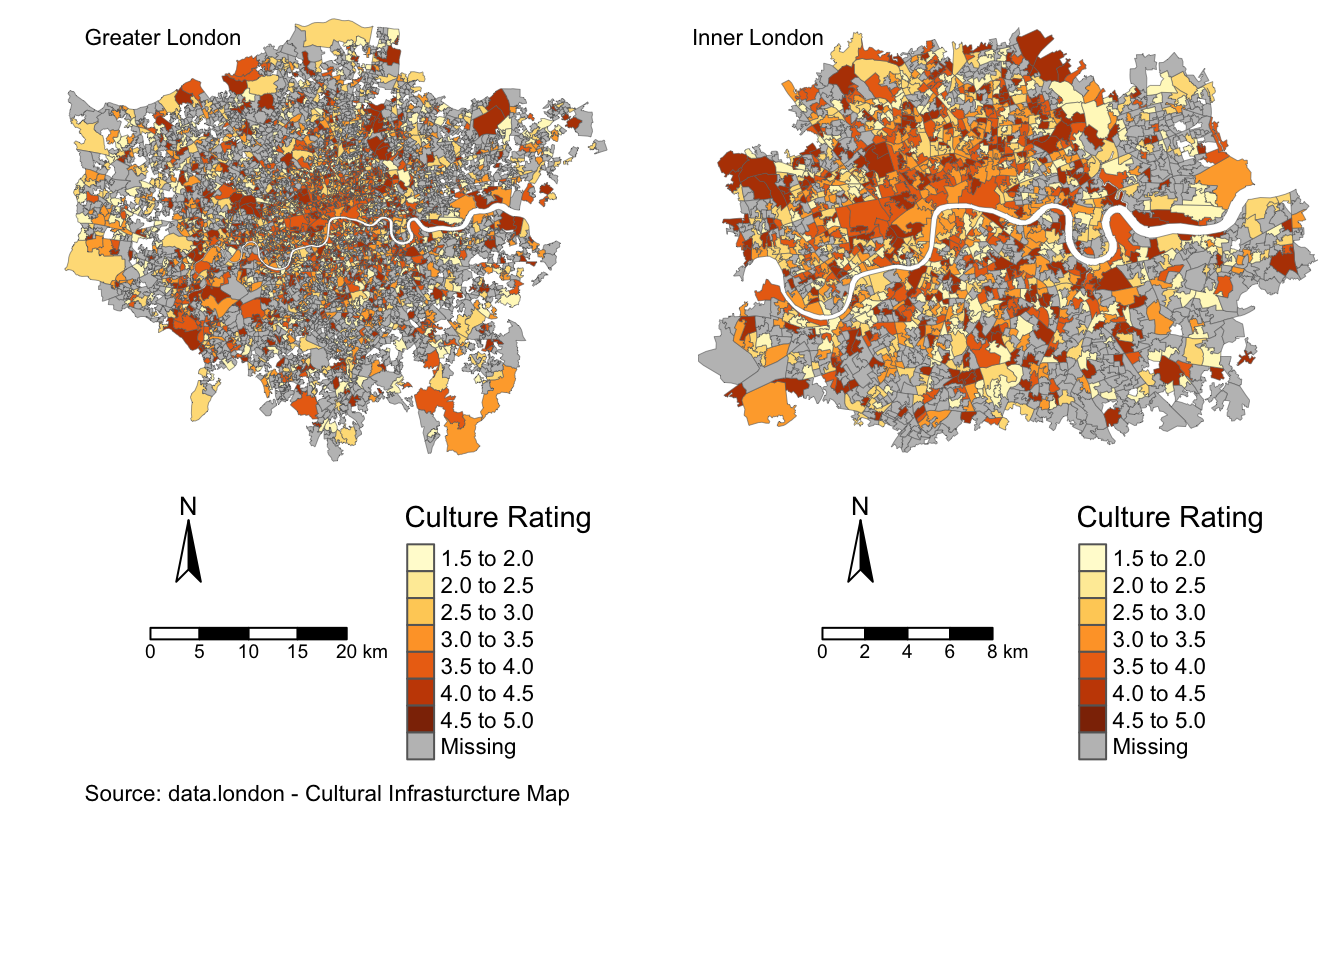
5.4 Airbnb freq density map - Supply & Demand
#-----------------------------------
airbnb_freq_london <- tm_shape(londonLSOAProfiles) +
tm_borders(col = 'dimgray', lwd = 0.3, lty = "solid") +
tm_polygons(col = 'airbnb_freq', style = 'order') +
tm_layout(title = 'Supply', frame=FALSE) +
tm_legend(show =FALSE) +
tm_credits("Greater London", position = c(0.1, 0.9), size=0.7 )
airbnb_freq_inner_london <- tm_shape(londonLSOAProfiles_inner) +
tm_borders(col = 'dimgray', lwd = 0.3, lty = "solid") +
tm_polygons(col = 'airbnb_freq', style = 'order') +
tm_layout(frame=FALSE) +
tm_legend(show =FALSE) +
tm_credits("Inner London", position = c(0, 0.9), size=0.7)
legend1 <- tm_shape(londonLSOAProfiles) +
tm_polygons(title = "Airbnb Freq (km2)", col = "airbnb_freq") +
tm_scale_bar(position=c(0.2, 0.6), text.size=0.6) +
tm_compass(north=0, position=c(0.2, 0.8)) +
tm_layout(legend.only = TRUE, legend.position=c(0.6, 0.4), asp=0.1) +
tm_credits("Source: Inside Airbnb", position=c(0.1, 0.3))
legend2 <- tm_shape(londonLSOAProfiles_inner) +
tm_polygons(title = "Airbnb Freq (km2)", col ="airbnb_freq") +
tm_scale_bar(position=c(0.2, 0.6), text.size=0.6) +
tm_compass(north=0, position=c(0.2, 0.8)) +
tm_layout(legend.only = TRUE, legend.position=c(0.6, 0.4), asp=0.1)
#+ tm_credits("Source: data.london - Cultural Infrasturcture Map", position=c(0, 0.3))
airbnb_freq_map = tmap_arrange(airbnb_freq_london, airbnb_freq_inner_london, legend1, legend2,
ncol=2)
#tmap_save(airbnb_freq_map, filename = "maps/density/airbnb_freq_lsoa.png")
#-----------------------------------
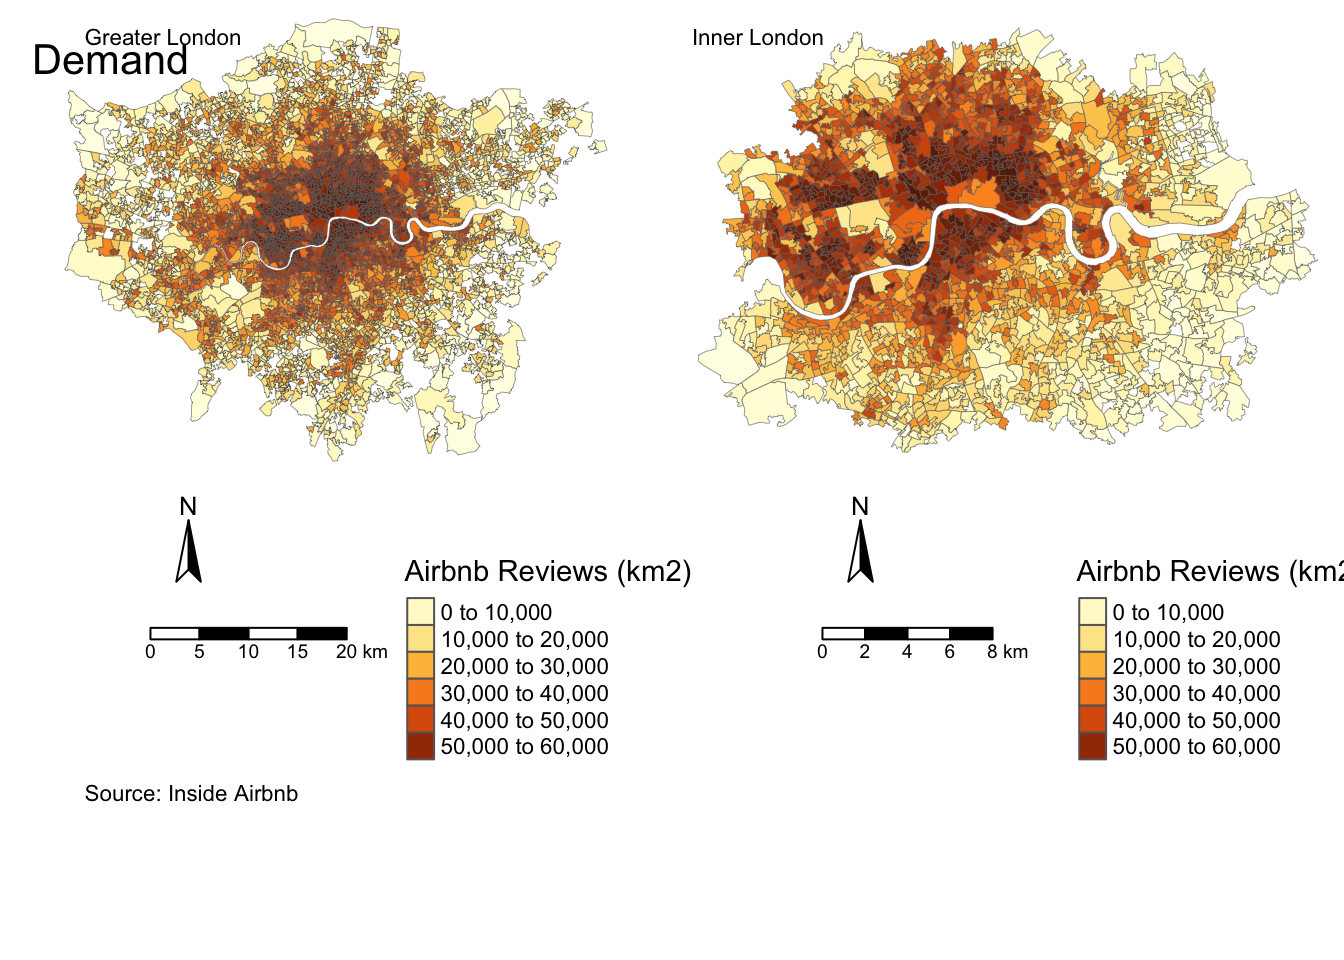
airbnb_reviews_london <- tm_shape(londonLSOAProfiles) +
tm_borders(col = 'dimgray', lwd = 0.3, lty = "solid") +
tm_polygons(col = 'airbnb_no_reviews', style = 'order') +
tm_layout(title = 'Demand', frame=FALSE) +
tm_legend(show =FALSE) +
tm_credits("Greater London", position = c(0.1, 0.9), size=0.7 )
airbnb_reviews_inner_london <- tm_shape(londonLSOAProfiles_inner) +
tm_borders(col = 'dimgray', lwd = 0.3, lty = "solid") +
tm_polygons(col = 'airbnb_no_reviews', style = 'order') +
tm_layout(frame=FALSE) +
tm_legend(show =FALSE) +
tm_credits("Inner London", position = c(0, 0.9), size=0.7)
legend3 <- tm_shape(londonLSOAProfiles) +
tm_polygons(title = "Airbnb Reviews (km2)", col = "airbnb_no_reviews") +
tm_scale_bar(position=c(0.2, 0.6), text.size=0.6) +
tm_compass(north=0, position=c(0.2, 0.8)) +
tm_layout(legend.only = TRUE, legend.position=c(0.6, 0.4), asp=0.1) +
tm_credits("Source: Inside Airbnb", position=c(0.1, 0.3))
legend4 <- tm_shape(londonLSOAProfiles_inner) +
tm_polygons(title = "Airbnb Reviews (km2)", col ="airbnb_no_reviews") +
tm_scale_bar(position=c(0.2, 0.6), text.size=0.6) +
tm_compass(north=0, position=c(0.2, 0.8)) +
tm_layout(legend.only = TRUE, legend.position=c(0.6, 0.4), asp=0.1)
#+ tm_credits("Source: data.london - Cultural Infrasturcture Map", position=c(0, 0.3))
airbnb_reviews_map = tmap_arrange(airbnb_reviews_london, airbnb_reviews_inner_london, legend3, legend4,
ncol=2)
tmap_save(airbnb_reviews_map, filename = "maps/density/airbnb_reviews_lsoa.png")
airbnb_reviews_map